We are pleased to announce updates to the Canadian Aquatic Barriers Database!
In celebration of World River’s Day (September 24, 2024), the Canadian Wildlife Federation launched even more features to the Canadian Aquatic Barriers Database (CABD) web tool. These updates help us better understand the effects aquatic barriers are having on fish and fish habitat and to provide a new way for Canadians to help us improve the information included in the CABD.
The CABD is a standardized, central and curated repository for barrier and connectivity data in Canada that is easily and openly accessible! It is an important tool to support work in a variety of fields and sectors related to freshwater connectivity and aquatic barriers. The CABD is already being used by federal and provincial government groups, academics, conservation NGOs and Indigenous and community groups across Canada.
- Check out our accompanying webinar on the new CABD updates to learn more and see a walk-through of how the CABD web tool works >
The Canadian Aquatic Barriers Database is a multi-year project that is supported partially by financial contributions from Fisheries and Oceans Canada.
The Canadian Aquatic Barriers Database is also funded in part by the RBC Foundation in support of RBC Tech for Nature.
Always On: Working to Improve the CABD
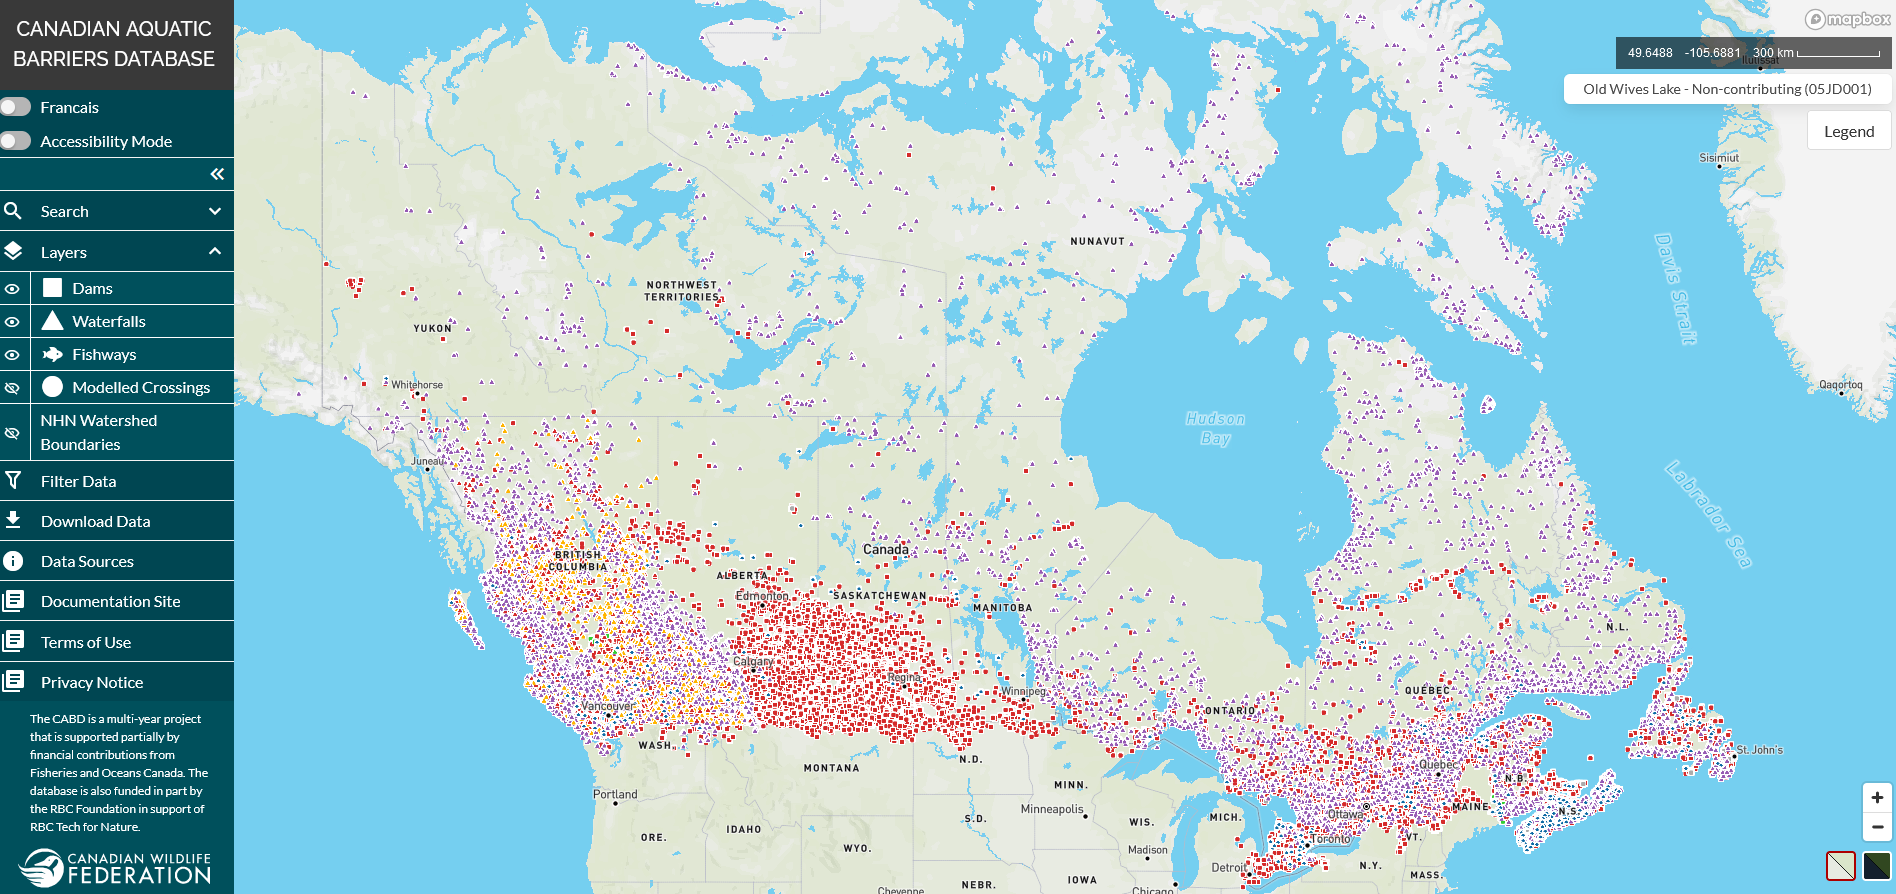 The initial release of the CABD on September 24, 2022, included available data on:
- Dams (>36,000 structures)
- Waterfalls (>25,000 structures)
- Fishways (>400 structures)
But these datasets are not perfect. Data gaps exist – we are going to be missing structures and need to fill in attribute gaps for the majority of existing points. However, we are committed to maintaining the CABD as the most comprehensive information source for aquatic barrier data in Canada by continuing to seek out ways to add information to the database. Over the past two years we have been able to add information for more than 3,000 features and are currently integrating information from more than 800 data sources!
Making these updates to existing CABD data is important to continue to improve the data available to help understand the scope of the problem that aquatic barriers pose, advocate for change and prioritize barriers for ecological restoration. However, there are other important steps we can take to update the CABD and make sure that it is continually improving and providing value across the country.
We’re excited to share two key updates that have just been released:
- National Stream Crossings: We have added a new type of aquatic barriers the CABD – version 1.0 of the national stream crossings dataset.
- Public Input on Local Barriers: A new feature in the CABD web tool that allows anyone to click on a barrier and contact us with information based on their local knowledge.
These two updates will help the CABD improve over time, fill data gaps, and better support important conservation and restoration work related to freshwater connectivity and fish passage in Canada.
1. Release of the National Stream Crossings Dataset
We know that aquatic barriers are prevalent across Canada, that barrier removal is needed to restore connectivity and access to vital habitat, and that restoration projects are expensive. But we don’t have the answers to some important questions:
- How many barriers exist in Canada?
- How much habitat is not accessible for fish and other species?
- How do we identify the most important barriers to restore and maximize benefits for these species?
The CABD is designed to be the comprehensive information source to help answer these questions in Canada.
The existing CABD data (dams, waterfalls and fishways) get us part way to being able to answer these questions and have been key in supporting connectivity conservation and fish passage restoration work to date. However, there are other important types of aquatic barriers on the landscape that affect freshwater connectivity and fish passage, including stream crossings.
What are stream crossings?
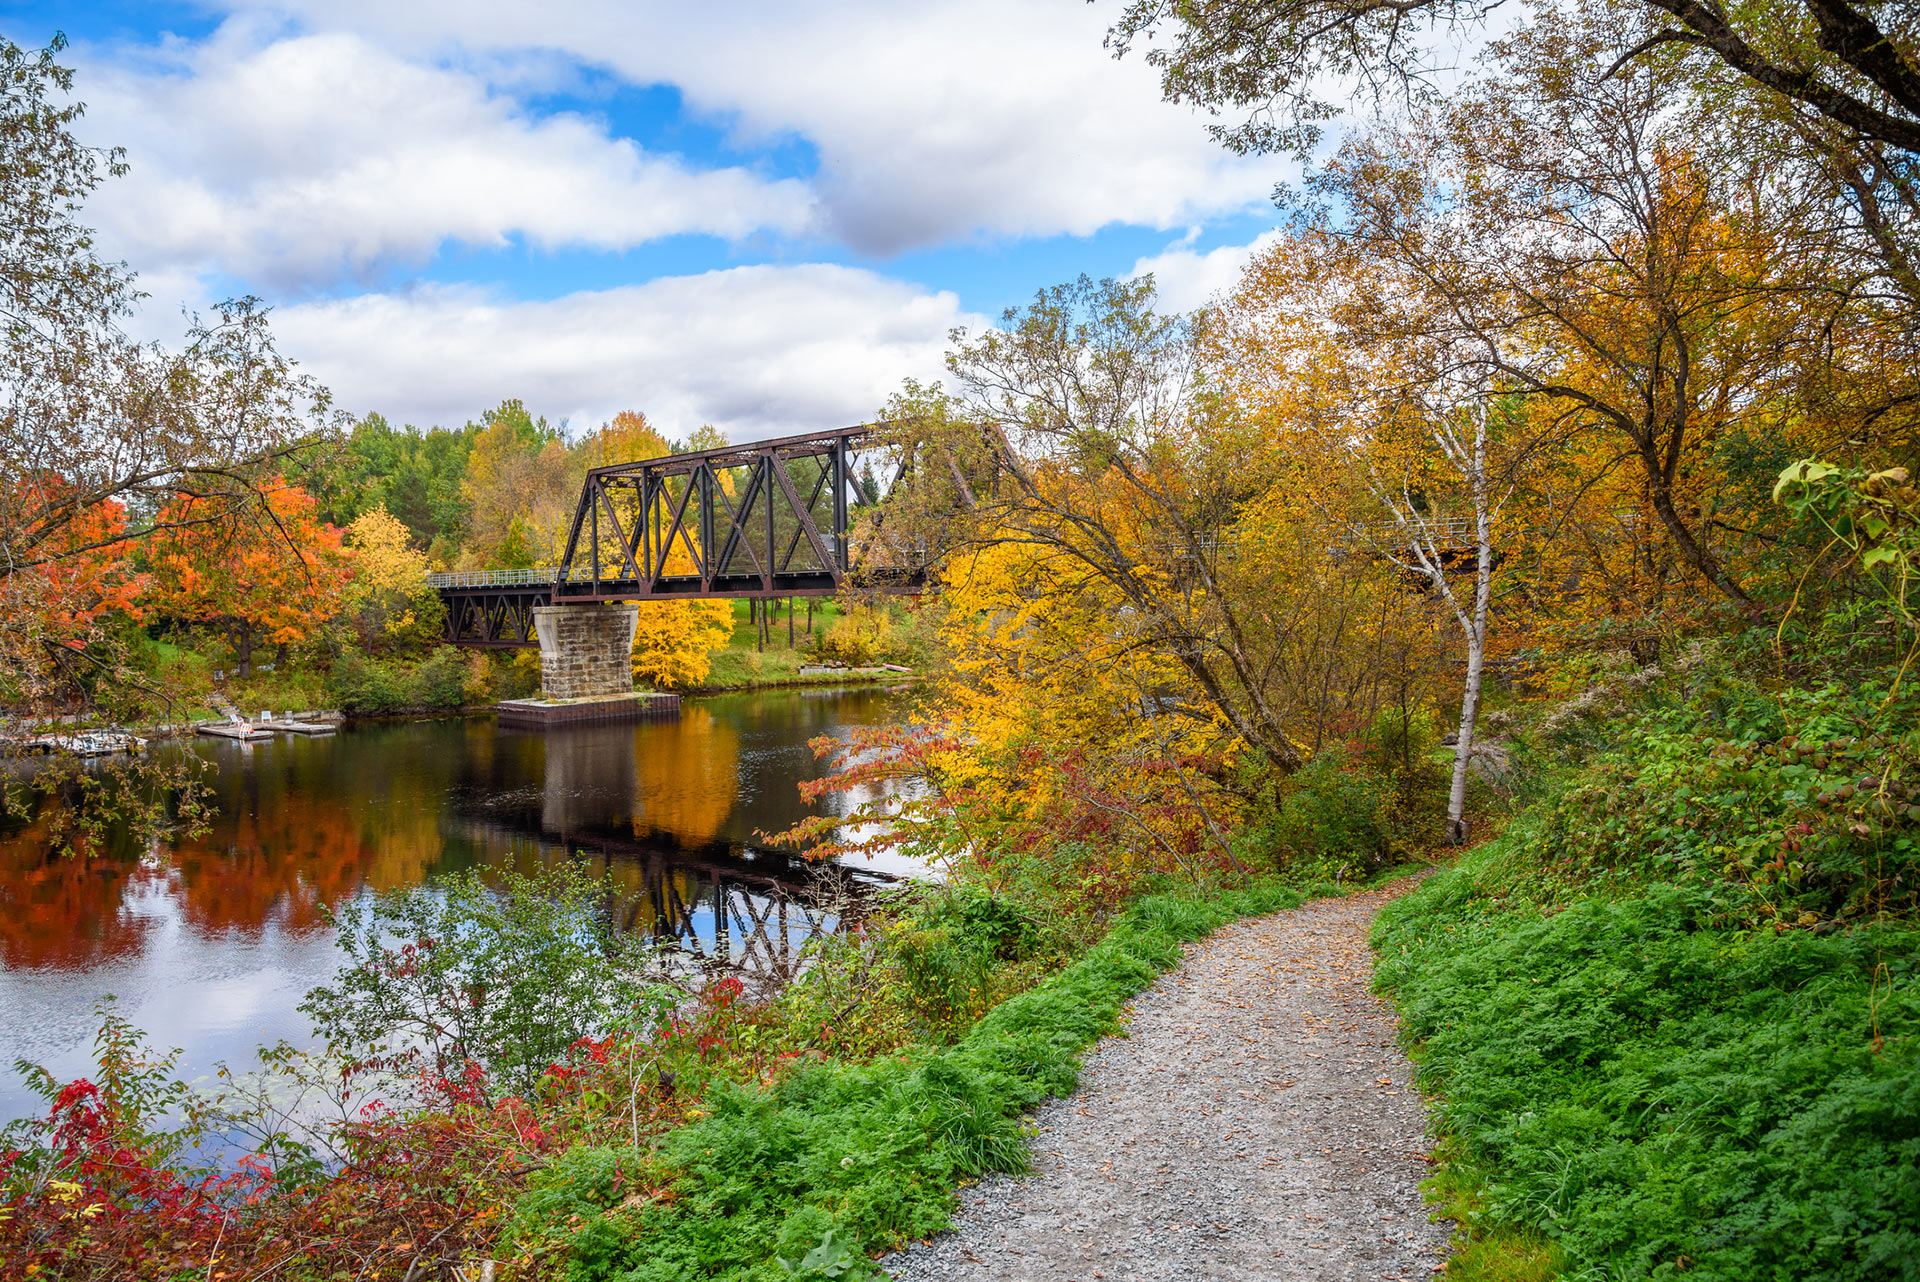
Stream crossing is a catchall term for any piece of transportation infrastructure (e.g., a road, rail line or trail) that crosses over a stream or river. Where these crossings occur, a structure is needed to allow transportation traffic to cross the waterbody, but also to allow water to continue to flow. Stream crossings can be closed-bottom structures (e.g., culverts), open-bottom structures (e.g., bridges) or fords. Culverts in particular frequently block fish movement if they are too small, steep, or perched above the stream.
The first version of the CABD national stream crossing dataset (stream crossings v1.0) comprises what we call “modelled crossings.” Modelled crossings are automatically generated stream crossings from the intersection streams and transportation networks (roads, rail lines and trails) in Canada. We have digital layers representing these features and anywhere a transportation network crosses paths with a stream or river, we assume there is some kind of stream crossing structure. This is a necessary starting point, but these modelled crossings have not been field verified – many of them will not be barriers to fish passage and some might not even exist (due to errors in the stream and transportation digital layers).
We are releasing information on over 1.5 million modelled stream crossings in Canada with version 1.0. This number is much higher than the more than 30,000 dams in the CABD. The sheer number of modelled stream crossings implies that they have had a significant cumulative effect on freshwater connectivity. This seems like a big problem! However, as mentioned, many of these sites may not be barriers to fish passage.
Digging Deeper into the Data
If we dig deeper into the data, we can begin to reduce the estimate of the number of stream crossings that might pose fish passage concerns. We know that there will be many bridges or open-bottom structures that rarely block fish passage. However, we are not yet able to predict whether crossings are open bottomed in much of the country.
We can predict that crossings are open-bottomed based on the size of the stream, where the digital transportation layers include information on bridges, or where they can be seen in satellite imagery. In areas of the country where this has been completed, our best estimate is that around five per cent of all crossings can be identified as open-bottom structures. If we extrapolate this to the entire country, that represents around 75,000 open-bottom structures that rarely effect fish passage.
Narrowing It Down
We can reduce our estimates of the number of stream crossings affecting fish movement by excluding the smallest streams.The condition of headwater streams is extremely important for fish because they contribute to downstream habitat quality. However, they are often unused by or of marginal direct use to fish, so barriers to fish movement here are not generally a significant concern. Stream order is a measure of stream size, and first-order streams are the smallest – often representing the headwaters of systems or drainage gullys in higher elevation areas.
We have only developed stream-order data for a portion of the country. In those areas we find that about 61 per cent of all stream crossings fall on first-order streams. Nationally, that means 915,000 stream crossings may fall on first-order streams and have a lower likelihood of fragmenting useable fish habitat, leaving about 510,000 stream crossings that are potential barriers (when account for the 75,000 open-bottom structures). These can be assessed in the field to evaluate if they are barriers and whether they block important habitat.
Finally, existing stream-crossing assessment data indicate that for non-open-bottom structures there are fish-passage concerns at 60 to 80 per cent of stream-crossing structures. So, if we apply those rates to the 510,000 potential barriers, we can estimate that 306,000 to 408,000 stream crossings may have fish passage concerns in Canada.
306,000 to 408,000 stream crossings may have fish passage concerns in Canada
Even then, not all are likely to be priorities for restoration. In the Horsefly River in British Columbia, for instance, we reviewed 2,500 potential barriers and identified that only around 45 of those barriers actually block Pacific Salmon habitat. Of these, only 13 barriers block 75 per cent of the habitat. This means most of the problem can be solved by addressing 13 of 2,500 potential barriers!
Analysis Makes Real Solutions Possible
This is still a big issue, but it is a solvable issue. Even 408,000 stream crossings is a big number, but it is a good starting point to prioritize assessments and other efforts to and quantify the effect these structures are having on freshwater connectivity. As we continue to update and refine the stream-crossing data in the CABD we’ll be able to better prioritize restoration efforts to improve fish passage and open up important habitat for fish species.
The CABD stream crossing layer will continue to be improved over time. We are currently seeking out existing stream crossing assessment data to incorporate into our dataset, which will help provide more certainty about the number of potential stream crossing barriers that exist. To this end, we are also developing some tools to help promote the collection of more field assessment data, including a community-science rapid barrier assessment mobile app and standardized national stream crossing assessment protocols. Stay tuned for more updates on these tools!
2. Public Submissions of Barrier Information Through the Web Tool
 As we’ve seen, there are a lot of potential aquatic barriers in Canada and a lot of data points for which we need more information. Despite CWF having a dedicated team who are continually seeking out new information to incorporate into the CABD, we can’t fill all these data gaps on our own. We need help, and that is where you come in!
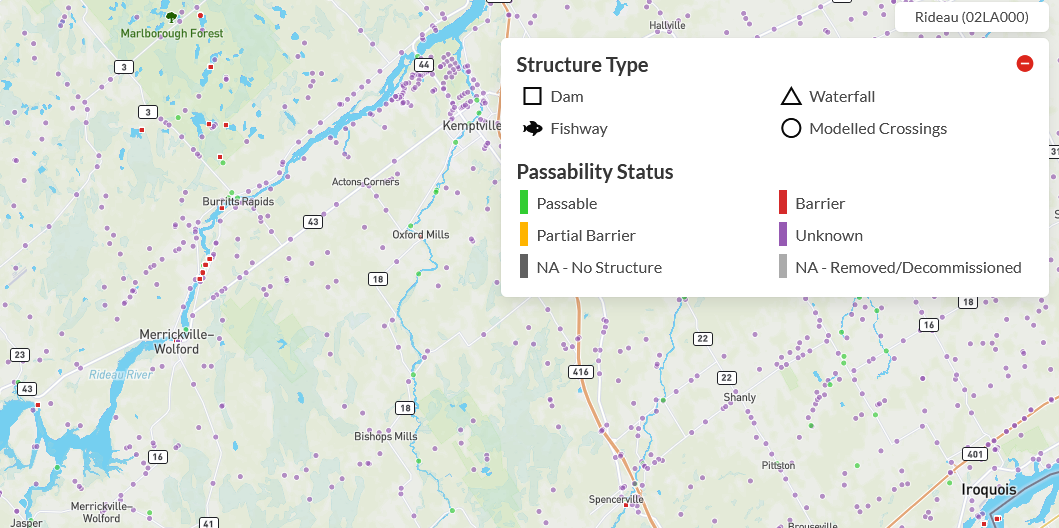
With this release, we are launching a new feature that allows anyone to provide information on aquatic barriers directly through the web tool. We’ve tried to make it as easy as possible to share any knowledge you have about structures in your area. Once you’re in the web tool, all you need to do is find the barrier you’re interested in on the map, navigate to it, and click on the barrier point. Once you do that, a popup will open that displays the information that we have for that barrier. If you notice that we’re missing any information, you can click on the ‘Update This Information’ tab within the popup, which will open a form that you can fill out.
We’re hoping that with this new feature we can work with Canadians across the country to improve the CABD more quickly and provide an even better product to support freshwater connectivity and fish passage work in Canada. Any help that you can provide is much appreciated!
What’s Next for CABD?
Between the work CWF is doing to compile stream crossing assessment data and continue our search to fill data gaps and the information that you can provide us through these new tools we’re excited to continue to make the CABD better and maintain it as the most comprehensive source for aquatic barrier and freshwater connectivity information in Canada.
Explore the CABD web tool or visit the documentation site to learn more about the project.
Nick Mazany-Wright
Nick Mazany-Wright works at the Canadian Wildlife Federation as a Senior Spatial Ecologist. Nick has a background in geospatial analysis and the restoration of freshwater and wetland ecosystems. His work includes using geospatial models and conservation planning tools to assess, prioritize and restore freshwater connectivity in aquatic ecosystems.

3 comments
I have the app CANADIAN FISH ASSESSMENT PASSAGEWAYS. Unfortunately there is no option to report installed fish ladders. There is one in Gananoque but the dam is being described as a barrier with no option to indicate it is a ladder.
Thanks for reaching out. This is the first version of the app and we are still making improvements. We appreciate your input and will try and make the updates to that site and improve the program. We are a not-for-profit charitable organization and doing our best to further enhance the system.
However, there is actually a way to indicate that there is a fish ladder. I’m not sure whether you are using the iOS or Android app, but you can see a screenshot here from the iOS app of the question asking whether there is a fish passage structure on the dam and then the option to take a picture of the fish passage structure.
Great app 🙂 Once my updates are submitted, is the information verified by someone at CWF, and the stream crossing/structure point will then be updated on the map on the app? Many unassessed crossings in my area, and I will soon lose track of those I have and have not yet assessed. Thank you!